




Case Study
Idaho Milk Products & Ever.Ag Sustainability
GHG Farm Footprint Validation, Audit-Ready Documentation, and Multi-Tool Analysis for Dairy Supply Chains
At a Glance
| Customer: | Idaho Milk Products |
| Industry: | Dairy Ingredient Supplier |
| Solution: | Ever.Ag Sustainability Group |
The Challenge
As a leading dairy ingredient supplier, Idaho Milk Products (IMP) initiated a pilot to proactively evaluate the consistency, auditability, and decision usefulness of farm-level greenhouse gas accounting methodologies commonly used across the dairy sector, getting ahead of increasing customer, regulatory, and investor expectations rather than waiting to respond to a specific requirement.
“The Ever.Ag managed service model gave us a credible, low-risk way to validate both the methodology and the platform before committing to a broader rollout.

Ever.Ag Solutions
Built for ag retail. Built for real-time decisions. Built to scale.
IMP engaged Ever.Ag’s Sustainability Group for a 12-month Managed Service Pilot – a fully supported engagement covering technology, statistical analysis, methodology, and farm footprint validation on Ever.Ag’s purpose-built sustainability platform.
Ever.Ag’s Sustainability Group enabled the team to:

Full platform configuration for IMP's corporate entity and producer ecosystem.
Annual farm footprint calculation for an enrolled dairy producer, covering 2025-year data.
Loading of complete footprint packages including Scope 3 survey data, FARM ES V2, FARM ES V3, and Cool Farm Tool, into the Ever.Ag Sustainability Platform.
Footprint certification: statistical process control checks, source document verification, manure system inspection, and dual attestation by evaluator and producer.
Results
15%
Footprint Correction Identified
2
Data Errors Corrected
3
Carbon Tools Benchmarked
100%
Audit Trail Documented
Multi-Tool Comparison
Using the audited Ever.Ag footprint as the verified baseline, the same farm data was run through FARM ES V2, FARM ES V3 and Cool Farm Tool to benchmark key differences.
Comparison: Original vs. Ever.Ag Audited
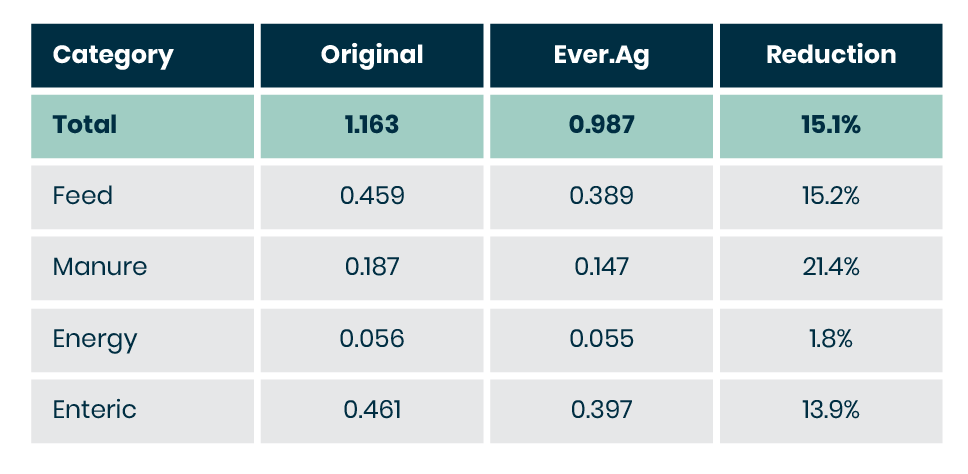
Values in lbs CO2e / lbs FPCM (Fat & Protein Corrected Milk)
The corrected footprint represents a 15.1% reduction from the original – a meaningful difference that would have resulted in overstated emissions in customer reports and supplier scorecards.
Comparison: Farm ES V2, V3 & Cool Farm Tool
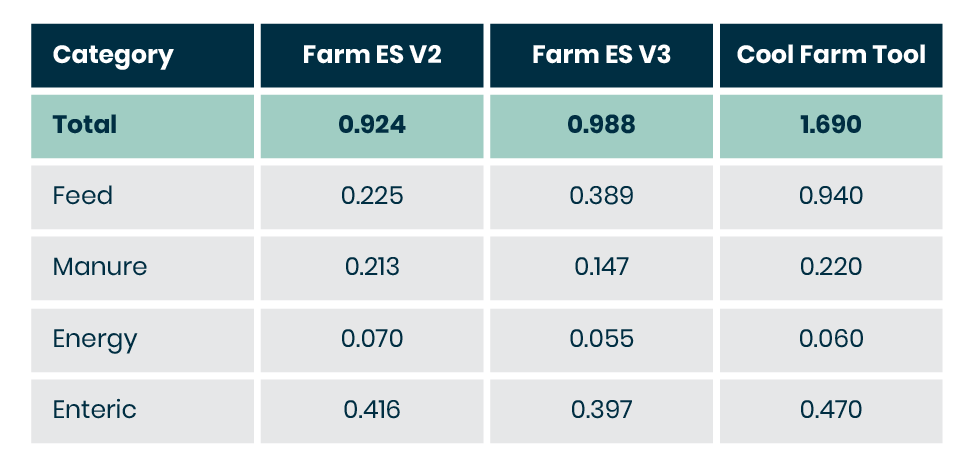
Values in lbs CO2e / lbs FPCM. V3 reflects Ever.Ag audited footprint.
Cool Farm Tool’s substantially higher feed emissions (0.94 vs. 0.389 in FARM ES V3) reflect fundamental differences in how each tool approaches feed emissions accounting, not differences in farm operations.