Publication Note
I’m on holiday next weekend, so no Monday Morning Demand Notes on February 16. We’ll be back with the February 23 edition.
The Scoreboard

Comment
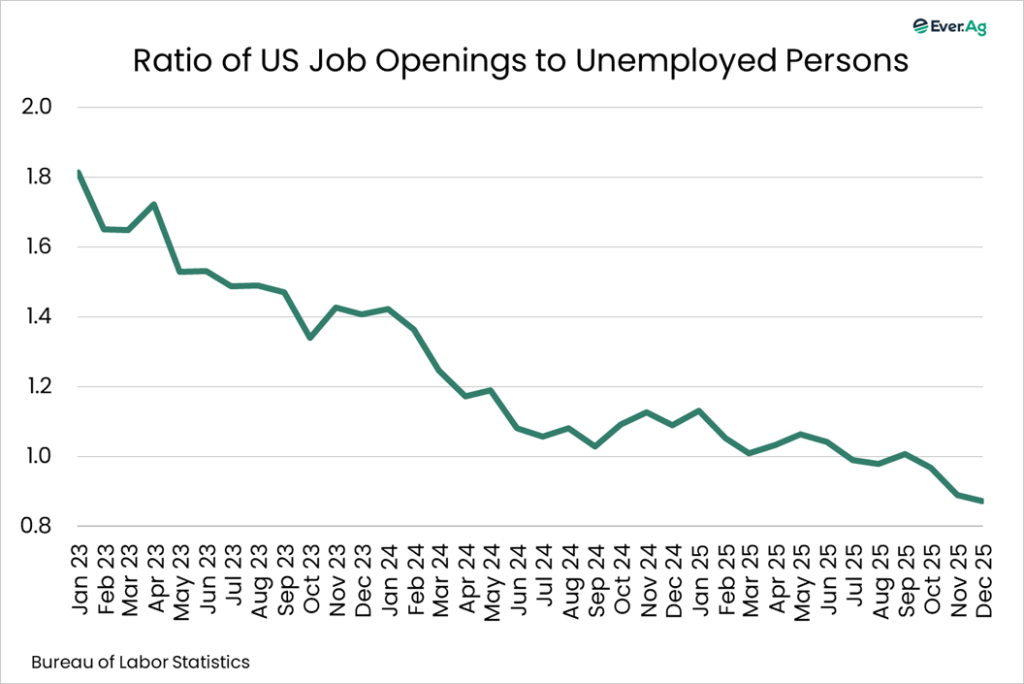
Last week, we learned that there are still some downside risks on the labor front. Two reports raised caution levels. First, the Job Openings and Labor Turnover Survey report from the US Bureau of Labor Statistics showed job openings in December dropping to the lowest level since 2020, with 6.54 million unfilled positions, down from 6.93 million in November and 7.31 million in December 2024. The ratio of openings to unemployed persons declined to 0.87, compared to 1.09 a year earlier. We’ve not seen a reading that low since February 2021. From May 2021 through June 2025, a stretch of more than four years, the labor market featured more openings than unemployed persons. It was easy to find a new job if you needed or wanted one. Now, we’ve seen more unemployed persons than openings in four of the past five reported months. We’ve seen worse, though. During the recession following the “Dot.com Bust” in 2001, the ratio averaged 0.63. During the “Great Recession” from December 2007 through June 2009, the ratio averaged 0.35. So, this isn’t a disaster. But it’s definitely not as good as it was.

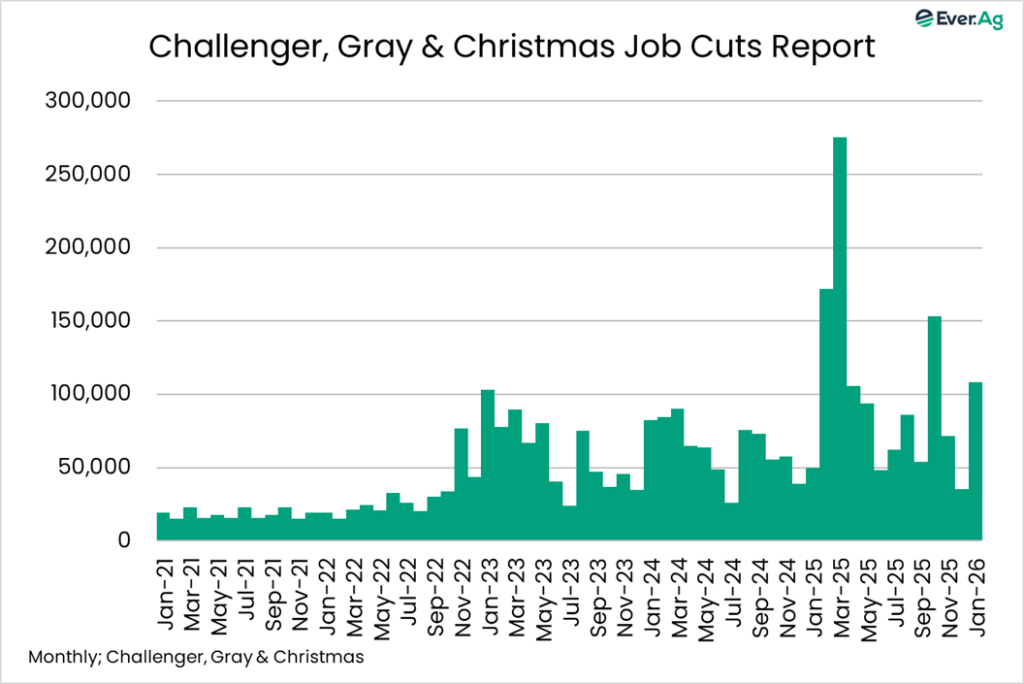
Second, layoffs accelerated in January. According to the Challenger, Gray & Christmas Job Cuts report, employers terminated 108,435 positions, more than triple the December total and more than double the number in January 2025. You have to go back to 2009 to find more cuts in January. Transportation companies announced the most job cuts at 31,243, led by moves by UPS. Technology came next, with 22,291 cuts, mainly from Amazon. The Challenger, Gray & Christmas release noted:
Artificial Intelligence was cited for 7,624 job cuts in January, 7% of total cuts for the month. Companies referenced AI for 54,836 announced layoff plans in 2025. Since 2023, when this reason was first tracked, AI has been cited in 79,449 job cut announcements, 3% of all layoff plans announced in that period. “It’s difficult to say how big an impact AI is having on layoffs specifically. We know leaders are talking about AI, many companies want to implement it in operations, and the market appears to be rewarding companies that mention it,” said Andy Challenger. “Generally, we see a high number of job cuts in the first quarter, but this is a high total for January. It means most of these plans were set at the end of 2025, signaling employers are less-than-optimistic about the outlook for 2026.

As with the JOLTS data, we’ve seen worse. Cuts soared early in 2025, but we never saw big problems. Bending, not breaking. I’m not convinced conditions will worsen over the medium term, but it’s delicate. From a consumer sentiment and spending perspective, fear of job loss has significant negative implications, whether or not layoffs materialize. The preliminary February reading of the University of Michigan Consumer Sentiment Index came in slightly above expectations (57.3 versus the call for 55.5). Still, it remains well below average, and labor concerns are at the forefront, with respondents reporting the highest probability of losing their jobs since July 2020.

* * *
What are the odds that legalized sports gambling is already a problem that will only get worse in the years ahead? Like many Americans, I participated in a “Super Bowl Squares” pool this year. More consequentially, since the Supreme Court allowed expanded sports gambling in 2018, data shows an 11-fold increase in the legal handle for Super Bowl bets, reaching an estimated $1.7 billion for yesterday’s game.

I don’t personally use online betting platforms like DraftKings or FanDuel. But a lot of people do. According to Civic Science, recent polling shows that 26% o Americans aged 21+ placed online sports bets at least a few times a year in 2025, with 15% betting weekly. Research from the University of Northern Colorado indicates that nearly 37 million people engaged in online sports betting in the US in 2025, with a forecast increase to 52 million in 2028. The total handle for legal sports betting was at $165 billion in 2025, up 11% from 2024.
An April 2025 study by researchers from USC and UCLA noted challenges associated with online sports gambling:
When states introduce access to online sports gambling, average credit scores decline by nearly three times as much (2.75 points). The decline in credit score is associated with changes in indicators of excessive debt. We find a substantial increase in average bankruptcy rates, debt sent to collections, use of debt consolidation loans, and auto loan delinquencies. Together, these results indicate that the ease of access to sports gambling is harming consumer financial health by increasing their level of debt.
According to the Harvard Gazette:
A February study in JAMA Internal Medicine noted that internet searches for gambling-addiction help have risen 23% nationally from the 2018 court ruling through June 2024. “When new forms of gambling appear, the rate of savings go down, then you see the rate of credit card defaults going up. And you see the rate of mortgage defaults going up. So these are long-term financial and societal costs with broad implications,” said Malcolm Sparrow, professor of the practice of public management at Harvard’s John F. Kennedy School of Government.
We’re seeing substantial money diverted from other uses, and companies like FanDuel are spending billions annually on marketing to maintain momentum. Before long, we’ll likely see and hear more reports that more people are in over their heads, creating at least modest risk for discretionary spending.
* * *
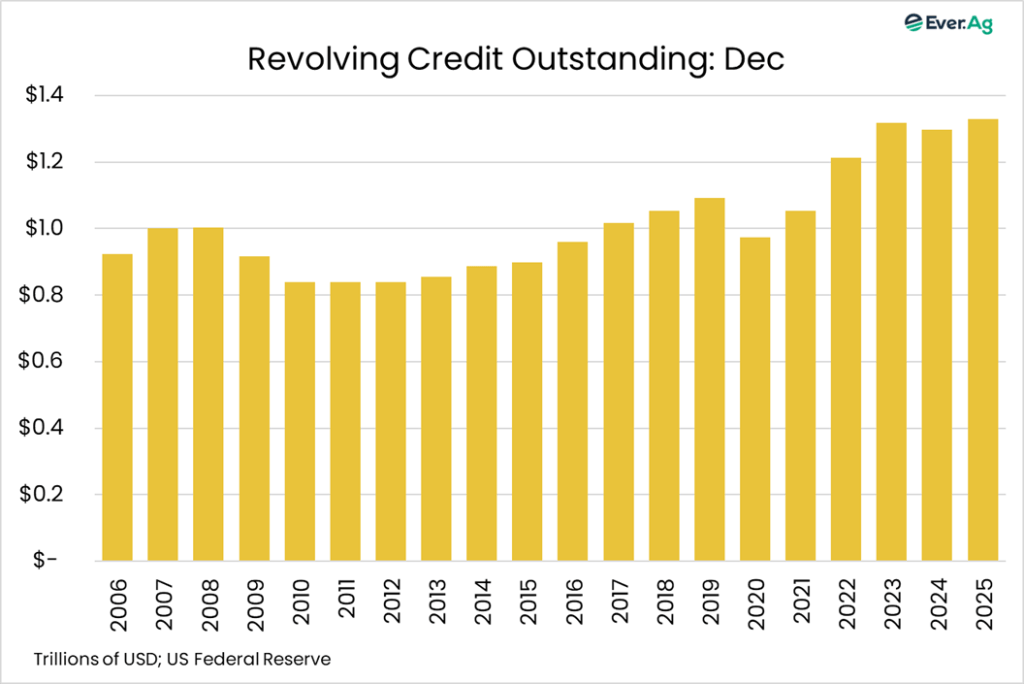
Consumer credit expanded at a stronger-than-expected pace in December. The US Federal Reserve reported total consumer credit outstanding at a record $5.11 trillion, up $24.0 billion from November, way ahead of the consensus call for +$8.4 billion. Credit cards led the way higher, with revolving debt up $13.8 billion on the month. At a high level, it appears that consumers financed a larger share of last year’s holiday spending. Are they in more peril as a result? We’ll get a better sense of delinquencies next week when the Federal Reserve Bank of New York publishes its consumer credit report for Q4.

* * *
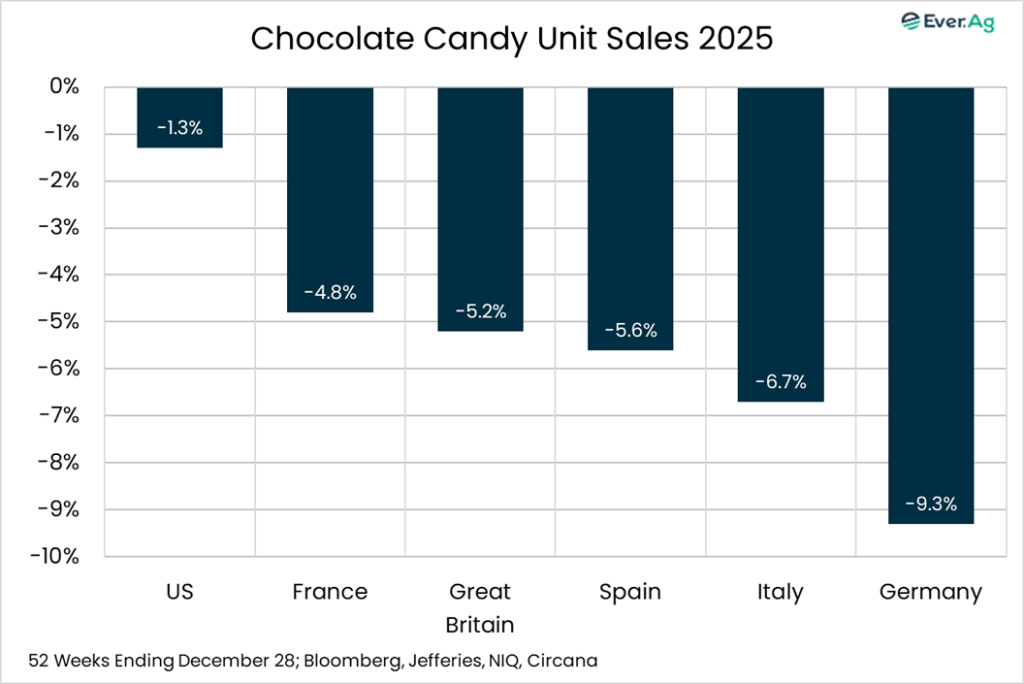
Markets work. Two Fridays back, cocoa futures traded below $4,000 per metric ton for the first time since November 2023. Between there and here, the market reached new highs, topping $12,000 per metric ton in 2024 — unthinkable for a product that averaged about $2,700 from 2014 through 2023. Adverse weather, tree disease and low pay for growers all contributed to the massive rally. High prices cure high prices, however, by discouraging demand and encouraging supply. That’s precisely what happened. On the demand side, confectioners raised prices and cut package size. Take milk chocolate M&M’s. The “family size” bag went from 19.2 ounces to 18.0 ounces, a 6% reduction. The package price at Walmart remained the same ($9.48), but the per-ounce cost increased from 49.4¢ to 52.7¢. The website Which? cites numerous examples from the UK—for example, Kit Kat multipacks shrinking from 21 bars to 18 bars —a 14% decrease —while the price increased 53% at one retailer. Sales declined in several countries. According to Jefferies, Circana data for the 52 weeks ending December 28 showed candy unit sales down in several countries, ranging from -1.6% in the US to -9.3% in Germany. At the wholesale level, cocoa grinding activity declined in North America and Europe. High prices, less demand. As expected. It’s harder to see the supply-side response, not least because cocoa trees take at least three years to bear fruit. But I think it’s safe to assume that growers did all they could to get more cocoa when prices were near their peak.
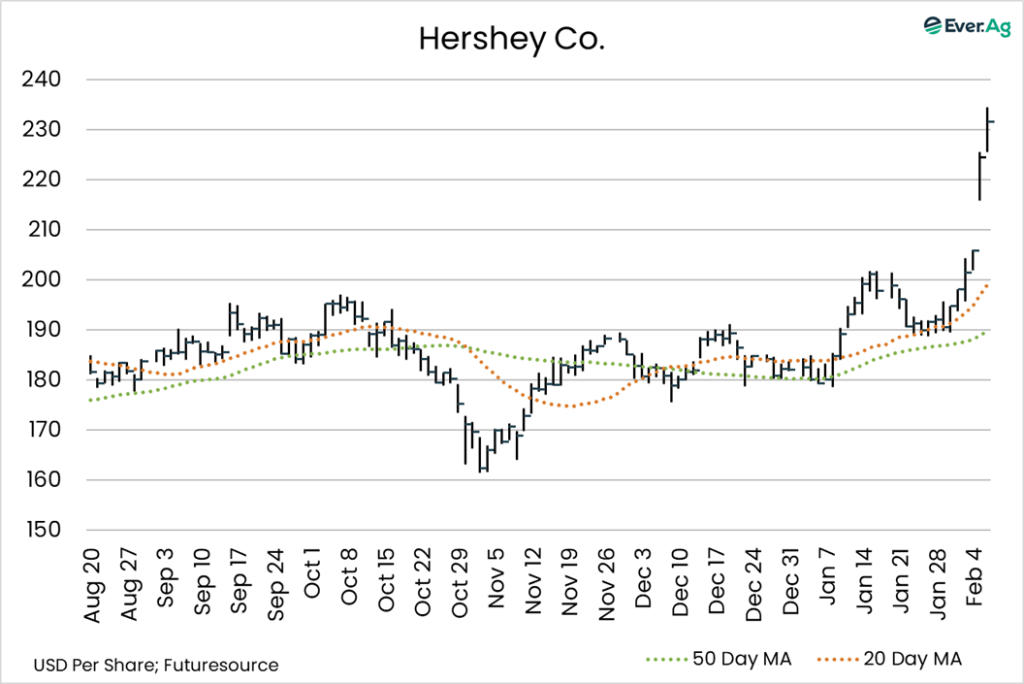
While $4,000 cocoa isn’t cheap by long-run historical standards, it’s far more palatable for confectioners and consumers than $12,000. So, what will happen now? We’ll likely see additional promotions that provide at least some price relief, with potential to boost demand (which, by the way, has positive implications for dairy powders and milkfat). This week, the Hershey Company reported better-than-expected quarterly results and guidance for the months ahead. The stock went wild, closing the week at $231.53 per share, up 43% from the November lows.


* * *
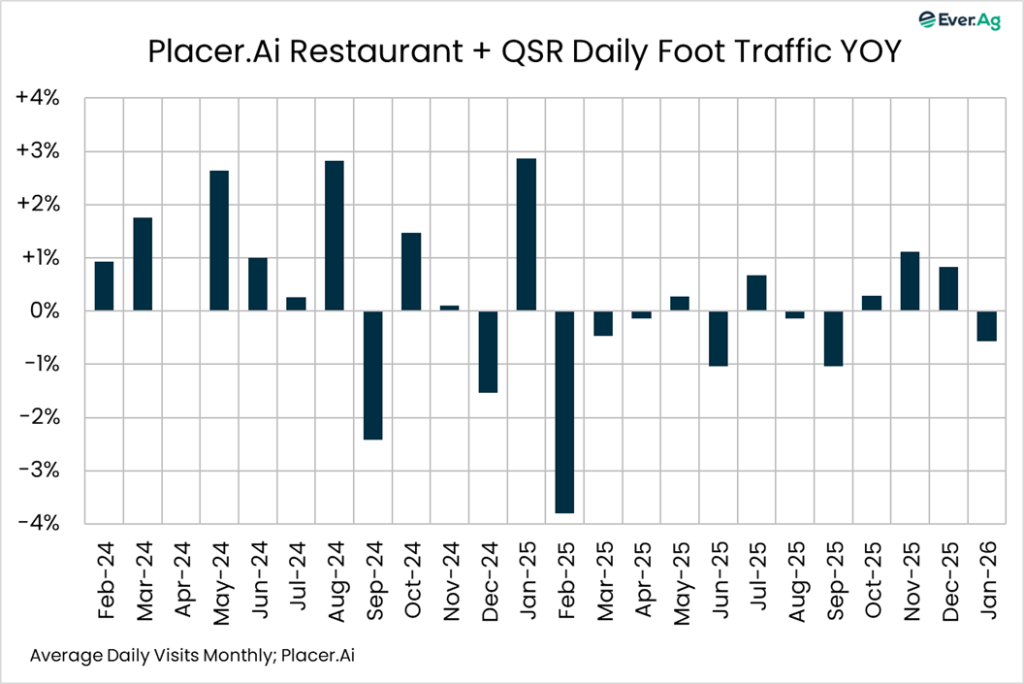
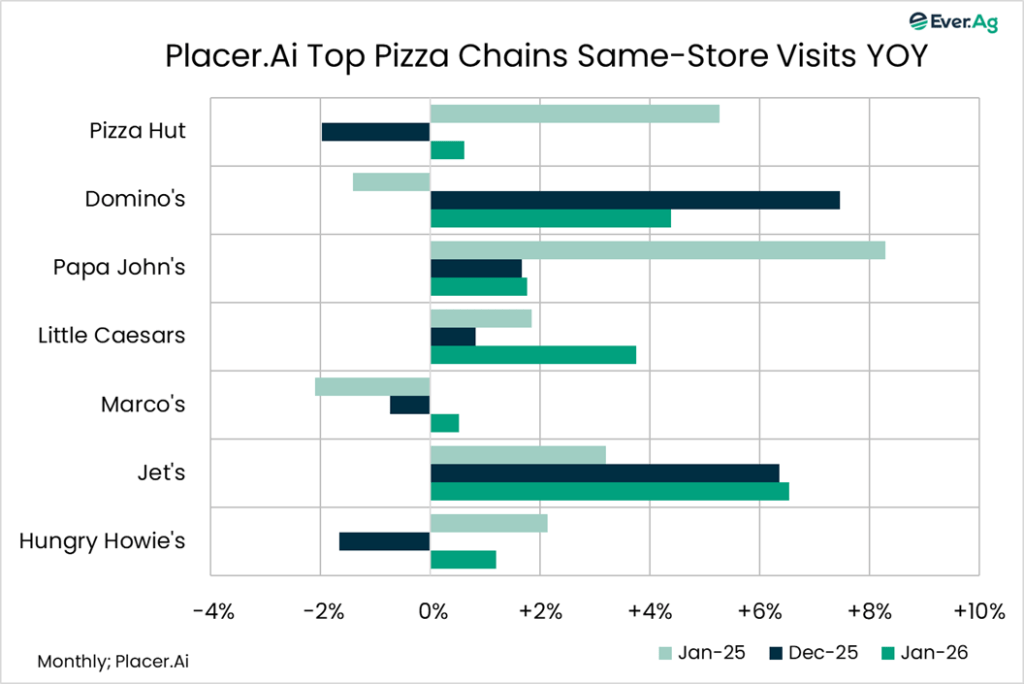
Food service traffic slumped in January, but “Big Pizza” saw mixed results. Restaurant + QSR foot traffic decreased by 0.6% year-over-year per Placer.ai data. It’s possible that widespread late-month winter storms hurt performance, but the decline wasn’t out of character with the multi-month trend. Pizza chains did slightly better, with same-store traffic positive for all seven of the largest chains, compared with four in December and five in January 2025. It’s not all good news, however, as Pizza Hut reported a 1% drop in same-store sales in Q4 and announced plans to close 250 units in the US in the months ahead. Finally, following up on last week’s discussion about Starbucks, same-store visits declined in January, with foot traffic down 1.6% versus -1.2% in December. Overall, it’s hard to believe that restaurants are driving much incremental demand growth for food commodities such as cheese and beef.

* * *
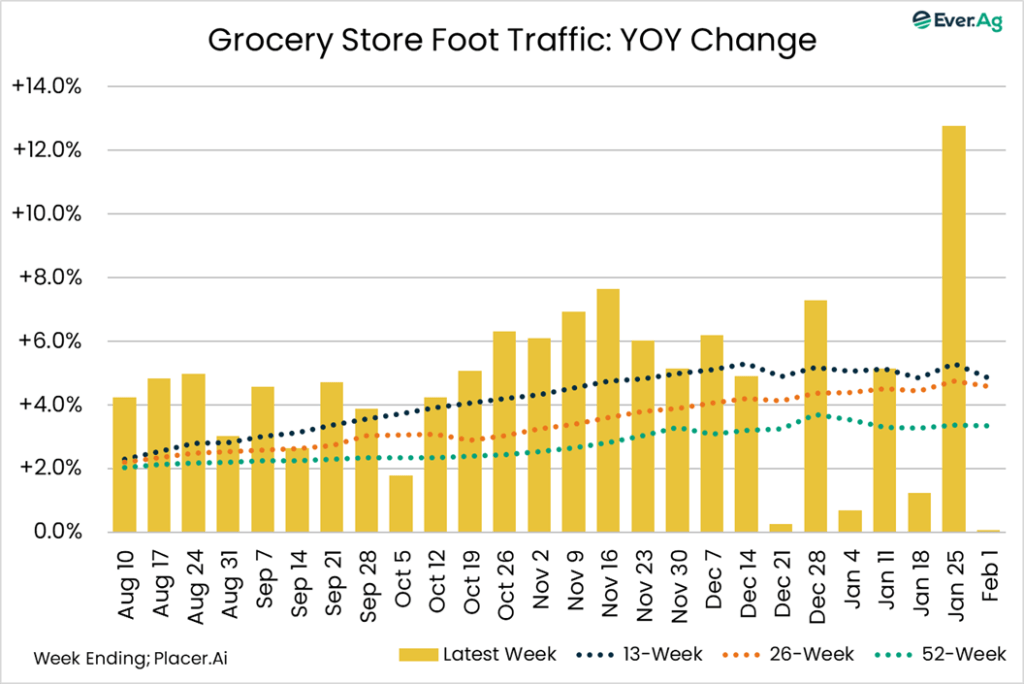
As anticipated, after the major storm passed, people had less need to go to the grocery store, dragging down sales. Placer.ai reported grocery store traffic at +0.1% year-over-year for the week ending February 1, the worst showing since early July. Cheese and milk sales suffered in the process, according to Circana. Natural cheese volume declined 4% year-over-year. Price climbed above $5.00 per pound for the first time since mid-September, with the average at $5.01, up seven cents on the week but down 3% year-over-year. Fluid milk volume also declined by 4%. Meanwhile, butter sales outperformed, with volume up by 4% year-over-year. The average price came in at $4.83 per pound, down six cents on the week and down 6% year-over-year.

* * *
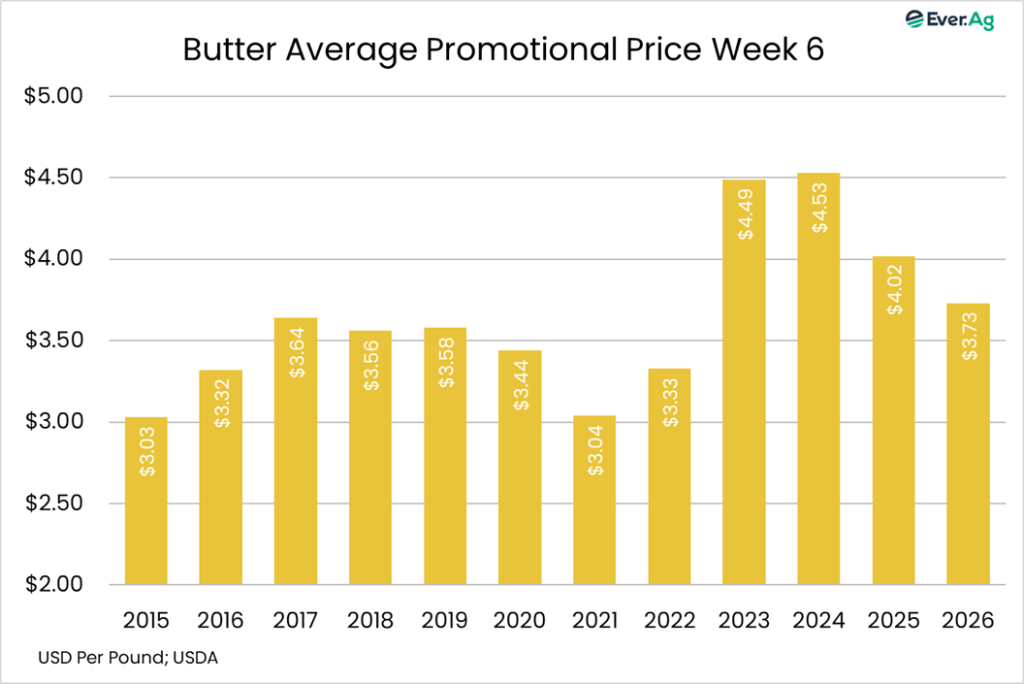
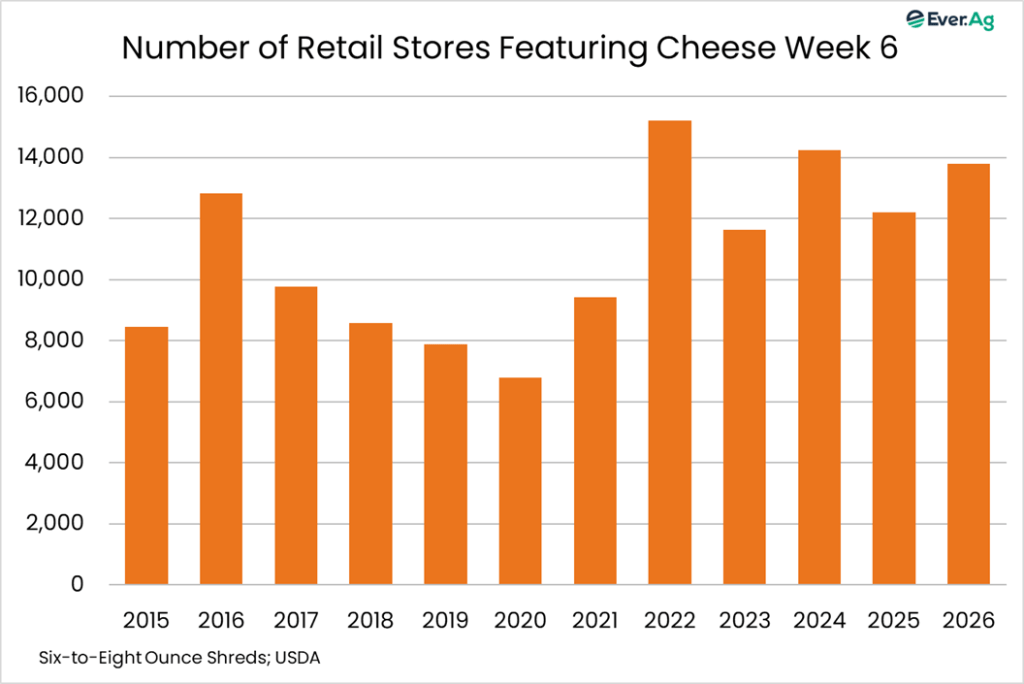
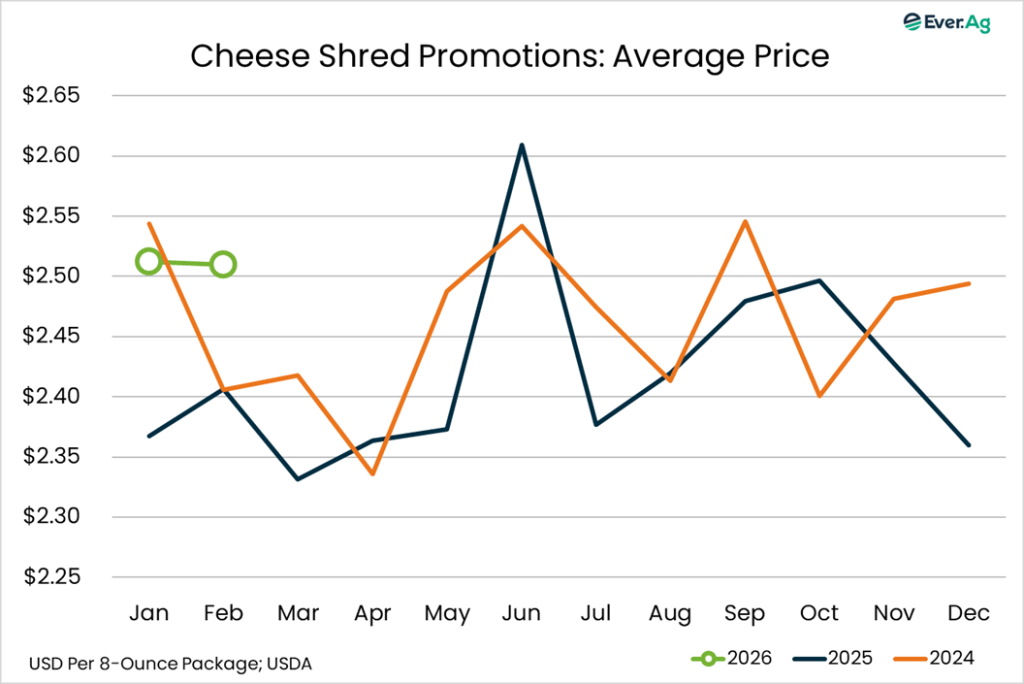
Promotional activity for butter and cheese continues to ramp up. According to USDA, the number of stores promoting butter increased for the third week in a row, with 10,175 outlets running specials, up 12% on the week and up 34% year-over-year. The average price slips to $3.73 per pound, down nine cents on the week and down 7% year-over-year. Six- to eight-ounce shredded cheese will be featured in 13,793 stores, up 9% for the week and 13% year-over-year. The average price goes higher, though: $2.51 per package, up 13 cents on the week and up 1% year-over-year.


Futures and options on futures trading involves significant risk and are not suitable for every investor. Information contained herein is intended for informational purposes and is obtained from sources believed reliable but is in no way guaranteed. Past results are not indicative of future results. Any data contained herein is proprietary and may not be copied, disseminated, or used without the express written permission of Ever.Ag Insights.