

Ever.ag Assistant
Ever.ag Assistant

This AI assistant may occasionally provide inaccurate or incomplete information.

AI-powered answers about Ever.ag
Model Comparison Guide
Amazon Nova Pro
Current default
$0.80 / $3.20 per 1M tokens

Amazon's mid-tier model. Good balance of quality and cost for RAG chatbots. Strong at following structured prompts and formatting rules.

Amazon Nova Lite
Lower cost
$0.06 / $0.24 per 1M tokens

Faster and cheaper than Nova Pro. Good for straightforward Q&A. Test whether the quality drop is noticeable for your visitors.

Amazon Nova Micro
Lowest cost
$0.035 / $0.14 per 1M tokens

Text-only, lowest latency in the Nova family. Best for simple factual lookups. May struggle with complex formatting instructions.

Claude Sonnet 4
Highest quality
$3.00 / $15.00 per 1M tokens

Anthropic's latest flagship. Excellent at following nuanced system prompts, inline linking, and natural conversational tone. Most expensive option but often the best output quality.

Claude Haiku 4.5
Fast & affordable
$1.00 / $5.00 per 1M tokens

Anthropic's fast, affordable model. Surprisingly capable for its price. Great candidate if Sonnet quality isn't needed for every query — compare to see the tradeoff.

Llama 3.3 70B
Open weights
$0.72 / $0.72 per 1M tokens

Meta's latest open-weight model on Bedrock. Strong general-purpose performance with competitive quality. Worth testing for cost predictability.

Hi! I'm the Ever.ag assistant. Ask me anything about our products, solutions,and services across the agriculture supply chain.
What can I help you with today? Pick an option below.

By continuing, I agree to Ever.ag's privacy policy

Case Study

Idaho Milk Products & Ever.Ag Sustainability

GHG Farm Footprint Validation, Audit-Ready Documentation, and Multi-Tool Analysis for Dairy Supply Chains

At a Glance

Customer: Idaho Milk Products
Industry: Dairy Ingredient Supplier
Solution: Ever.Ag Sustainability Group

The Challenge

As a leading dairy ingredient supplier, Idaho Milk Products (IMP) initiated a pilot to proactively evaluate the consistency, auditability, and decision usefulness of farm-level greenhouse gas accounting methodologies commonly used across the dairy sector, getting ahead of increasing customer, regulatory, and investor expectations rather than waiting to respond to a specific requirement.

“The Ever.Ag managed service model gave us a credible, low-risk way to validate both the methodology and the platform before committing to a broader rollout.

imp logo
{

Ever.Ag Solutions

Built for ag retail. Built for real-time decisions. Built to scale.

IMP engaged Ever.Ag’s Sustainability Group for a 12-month Managed Service Pilot – a fully supported engagement covering technology, statistical analysis, methodology, and farm footprint validation on Ever.Ag’s purpose-built sustainability platform.

Ever.Ag’s Sustainability Group enabled the team to:

Screenshot 2025 05 07 at 13 01 24 Foremost Supply Chain Case Study MRG – Ever.Ag 3

Full platform configuration for IMP's corporate entity and producer ecosystem.

Screenshot 2025 05 07 at 13 01 24 Foremost Supply Chain Case Study MRG – Ever.Ag 3

Annual farm footprint calculation for an enrolled dairy producer, covering 2025-year data.

Screenshot 2025 05 07 at 13 01 24 Foremost Supply Chain Case Study MRG – Ever.Ag 3

Loading of complete footprint packages including Scope 3 survey data, FARM ES V2, FARM ES V3, and Cool Farm Tool, into the Ever.Ag Sustainability Platform.

Screenshot 2025 05 07 at 13 01 24 Foremost Supply Chain Case Study MRG – Ever.Ag 3

Footprint certification: statistical process control checks, source document verification, manure system inspection, and dual attestation by evaluator and producer.

Results

With the engagement underway, IMP is realizing the benefits of a structured approach to supply chain sustainability:
N
Certified, audit-ready producer footprints built on a multi-methodology framework, meeting diverse customer and regulatory requirements in a single workflow.
N
A live software instance configured to IMP’s ecosystem, enabling administrators and producers to access and manage sustainability data in one place.
N
Footprint certification backed by Ever.Ag’s QA process, giving IMP confidence in the accuracy and defensibility of reported GHG data.
N
Comparative analysis of farm footprint data entered into leading farm GHG calculators, demonstrating critical differences between tools.
N
Low-friction onboarding from kickoff to completed farm evaluations in under 60 days.
N
A clear path to scale: the pilot framework expands to additional producers and reporting years without rebuilding methodology or infrastructure.

15%

Footprint Correction Identified

2

Data Errors Corrected

3

Carbon Tools Benchmarked

100%

Audit Trail Documented

Multi-Tool Comparison

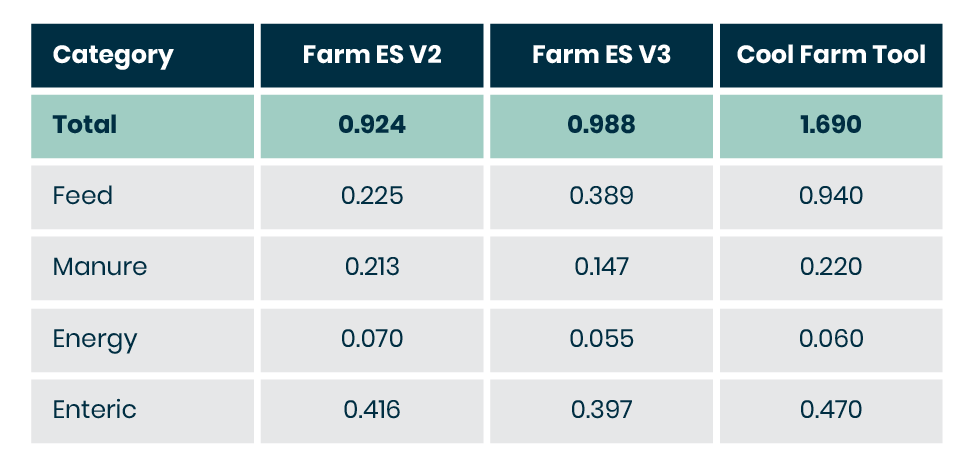
Using the audited Ever.Ag footprint as the verified baseline, the same farm data was run through FARM ES V2, FARM ES V3 and Cool Farm Tool to benchmark key differences.

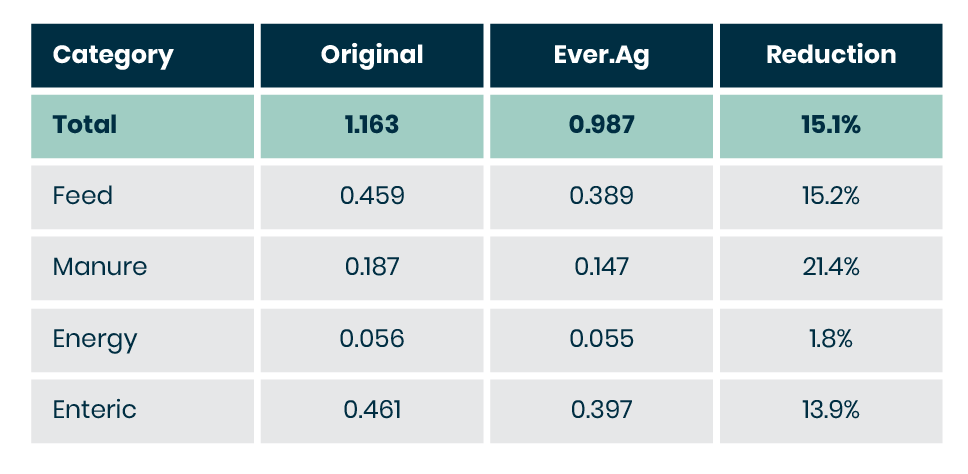
Comparison: Original vs. Ever.Ag Audited
Case Study IMP charts 01
Values in lbs CO2e / lbs FPCM (Fat & Protein Corrected Milk)
The corrected footprint represents a 15.1% reduction from the original – a meaningful difference that would have resulted in overstated emissions in customer reports and supplier scorecards.

Comparison: Farm ES V2, V3 & Cool Farm Tool
Case Study IMP charts 02
Values in lbs CO2e / lbs FPCM. V3 reflects Ever.Ag audited footprint.

Cool Farm Tool’s substantially higher feed emissions (0.94 vs. 0.389 in FARM ES V3) reflect fundamental differences in how each tool approaches feed emissions accounting, not differences in farm operations.